
9. Analytics
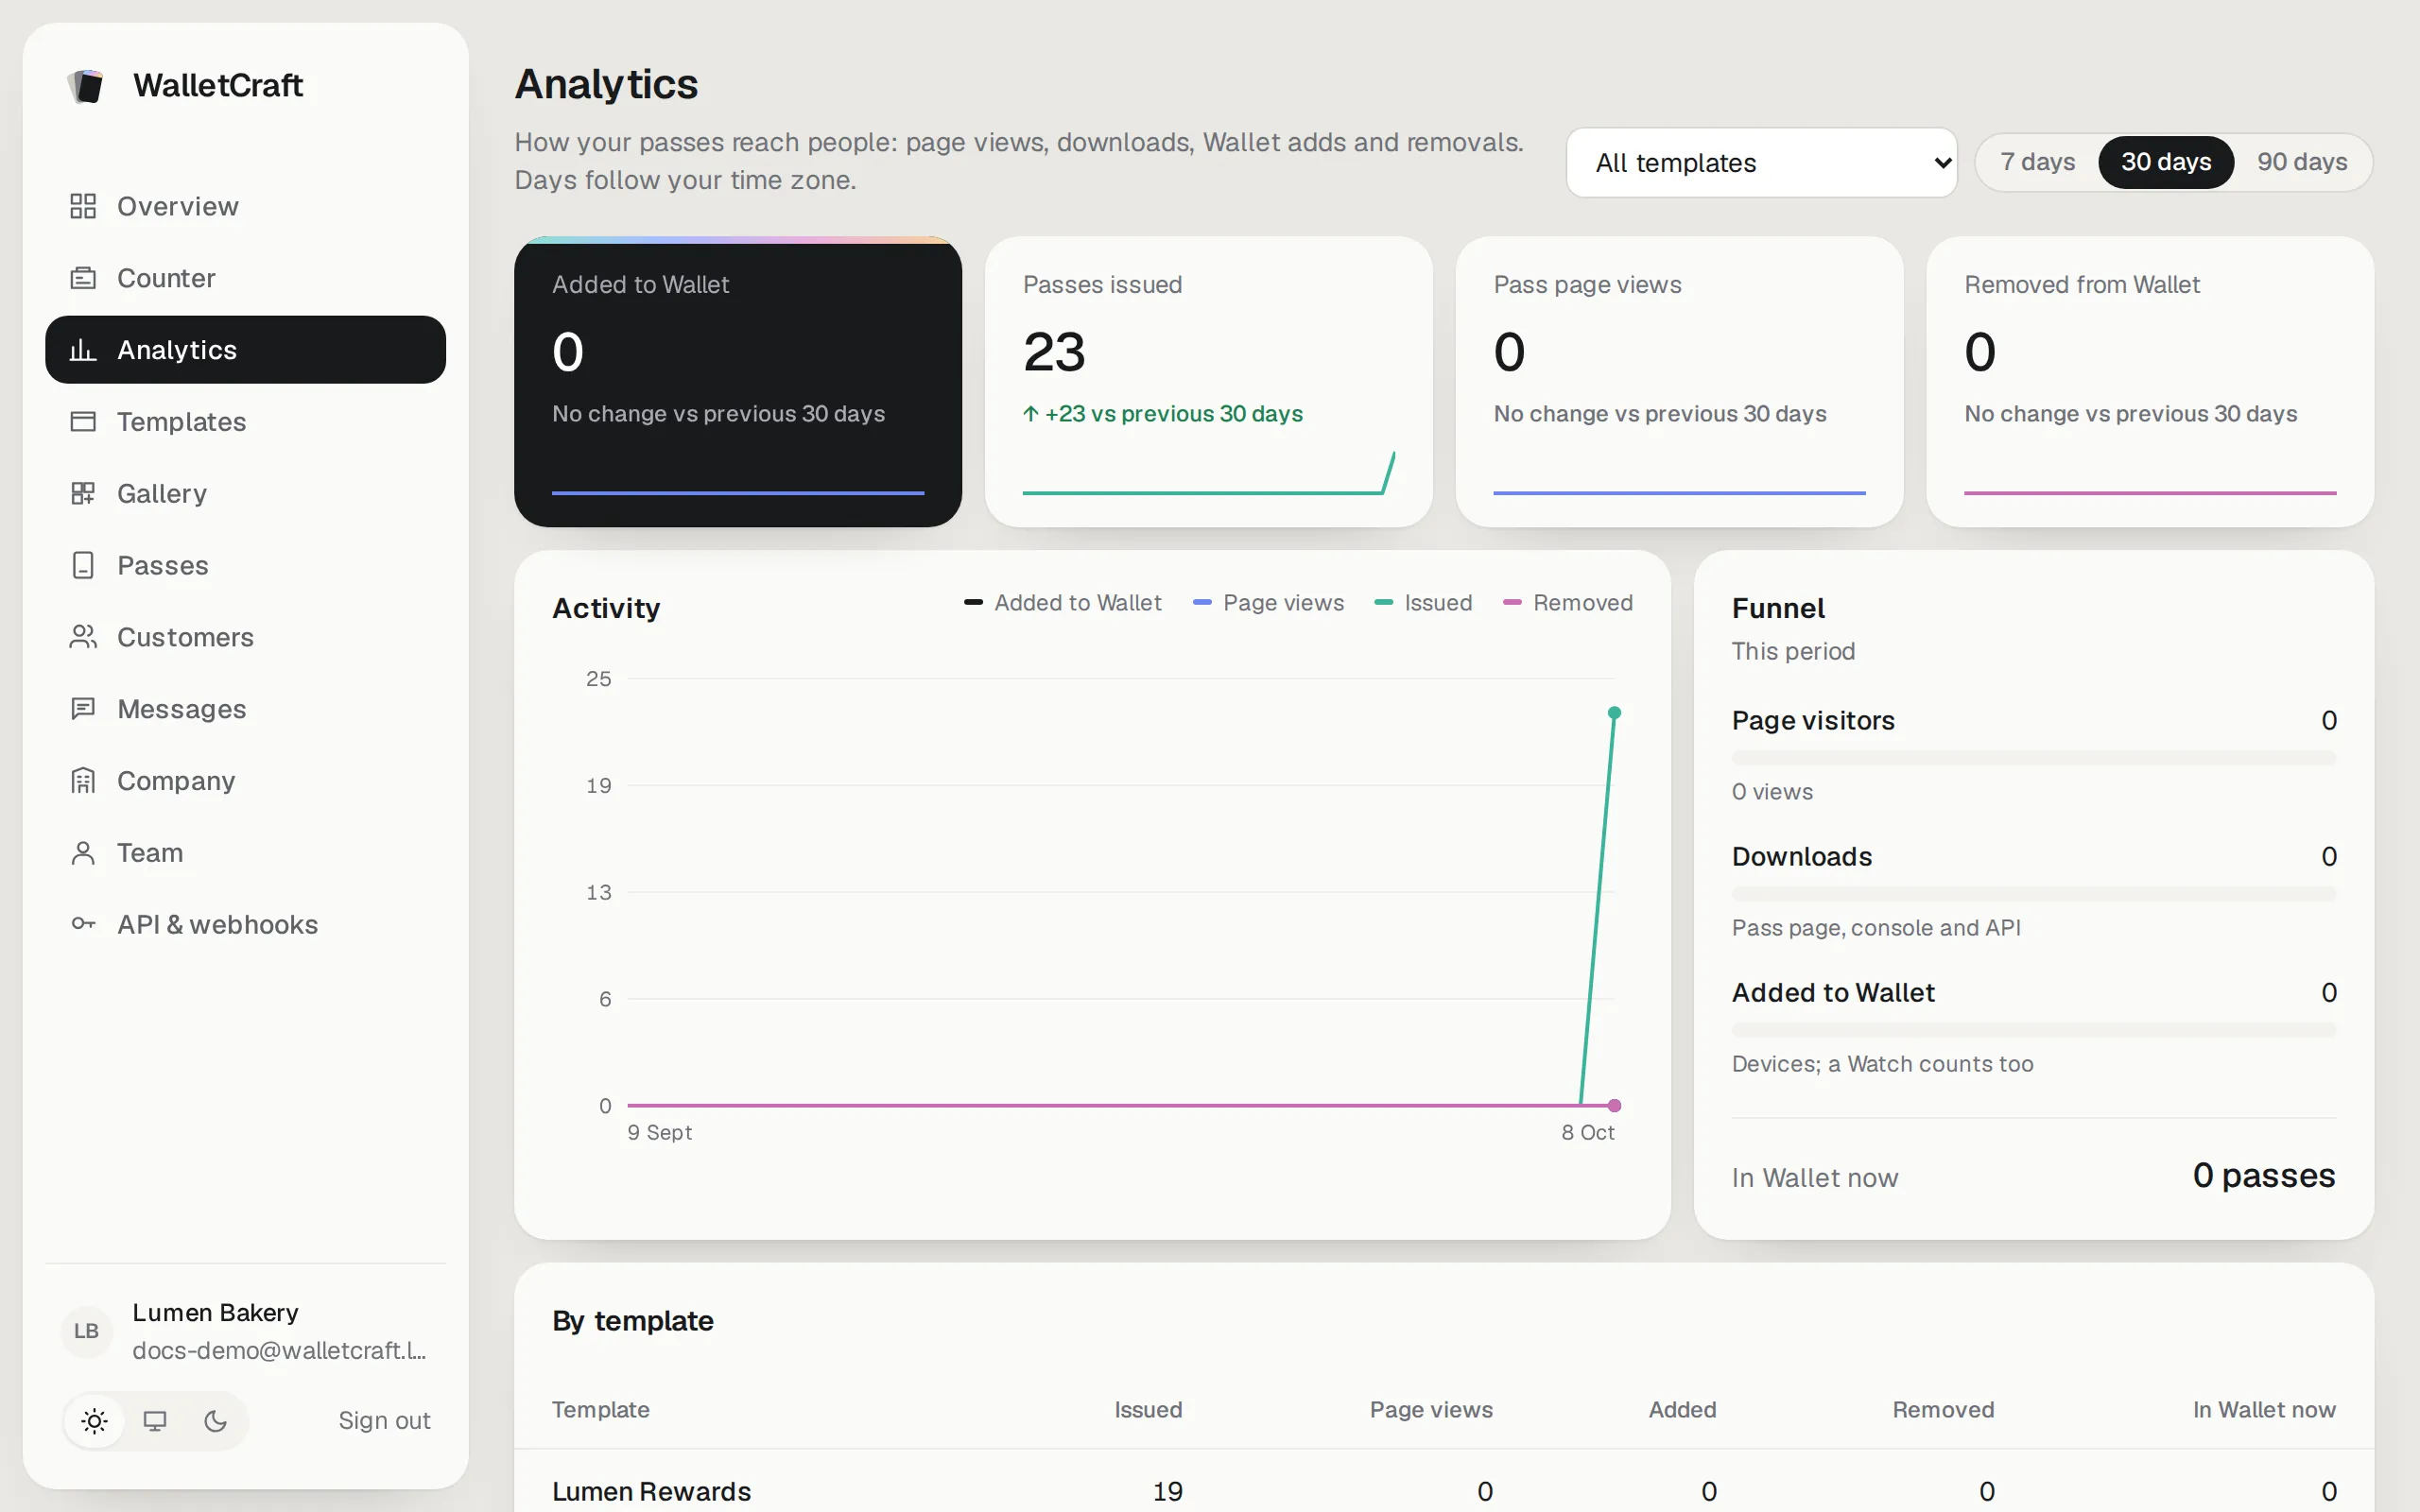
Open Analytics. Choose the period (7, 30 or 90 days) and, if you like, one template.
Key numbers
Section titled “Key numbers”| Number | Meaning |
|---|---|
| Added to Wallet | How many times cards were added to Apple Wallet or Google Wallet. |
| Passes issued | New cards in the period. |
| Pass page views | Visits to card pages (the page with the Add to Wallet buttons). |
| Removed from Wallet | How many times customers removed a card. |
Each shows the change against the previous period of the same length.
- Activity — the same numbers day by day.
- Funnel — from people who opened a card page, to downloads, to cards added to a wallet; In Wallet now is how many cards are on phones today.
- By template — the numbers per card design.
Where customers come from
Section titled “Where customers come from”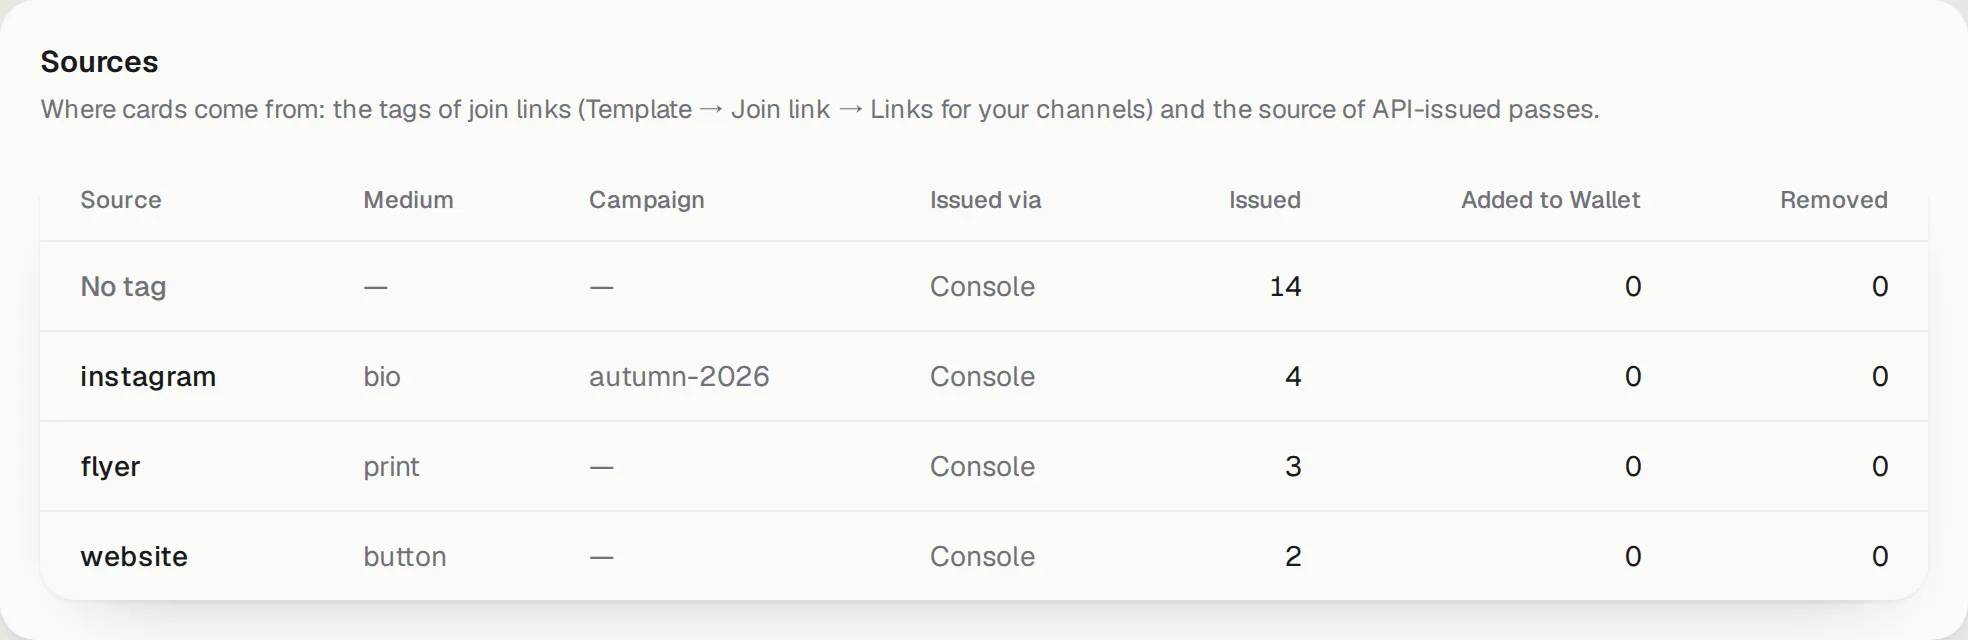
Sources groups cards by the channel they came from: the tags of your channel links (Instagram bio, flyer, website button…), or the source your website sends. No tag are cards issued without one, for example from the console.
What a card costs
Section titled “What a card costs”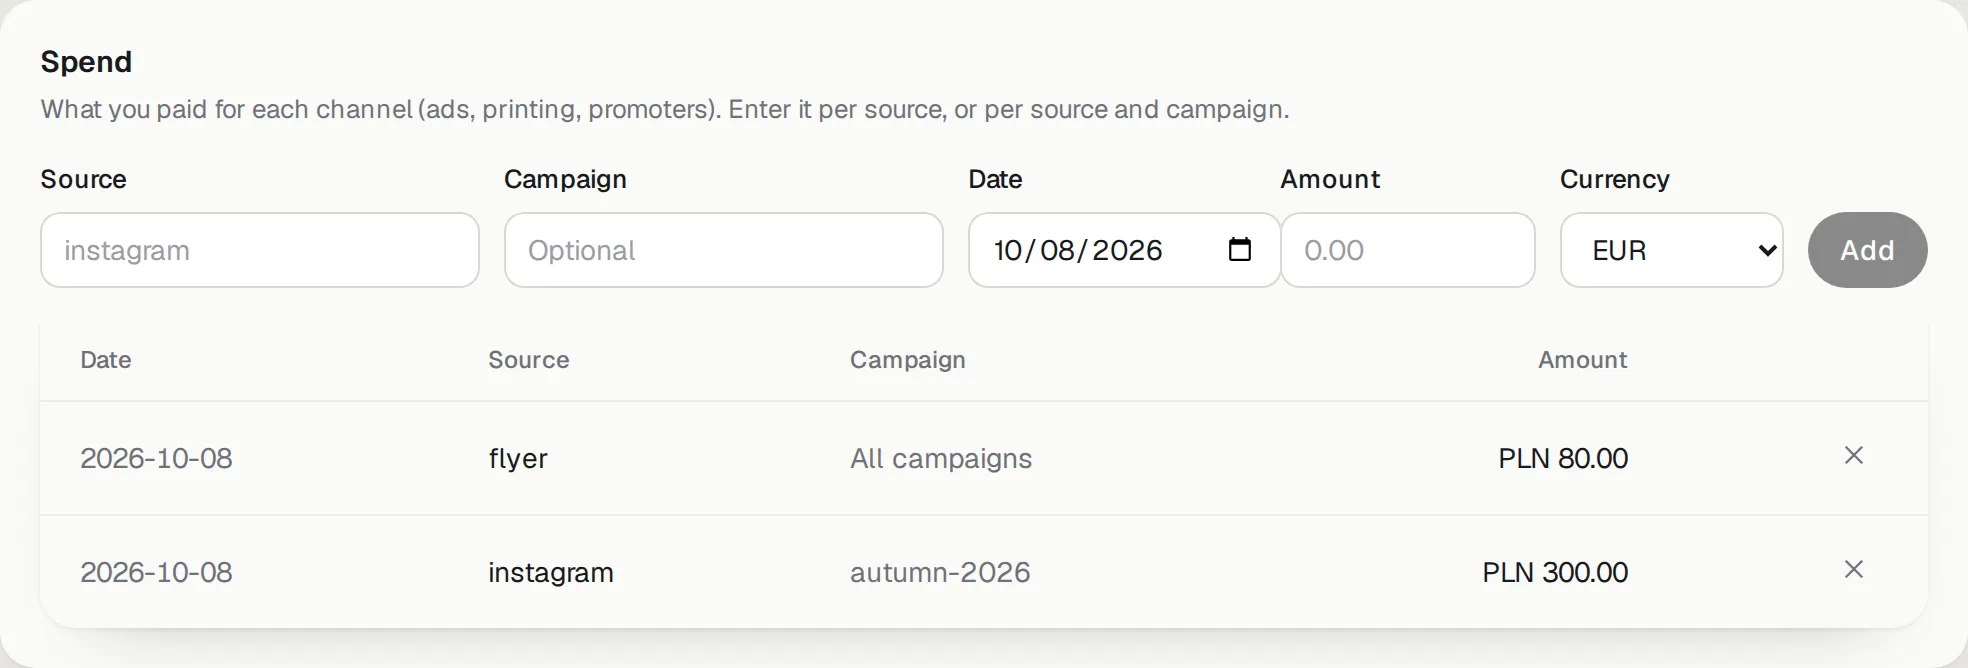
Enter what you paid for a channel under Spend: the Source (the same tag as in your links), optionally the Campaign, the Date, the Amount and its Currency. Cost per card then shows, per channel, how much each issued card and each card added to a wallet cost you — so you can see which channel is worth it.